Criticality (continued):
.
Thylacine
population decline - 1900 to 1940 (continued)
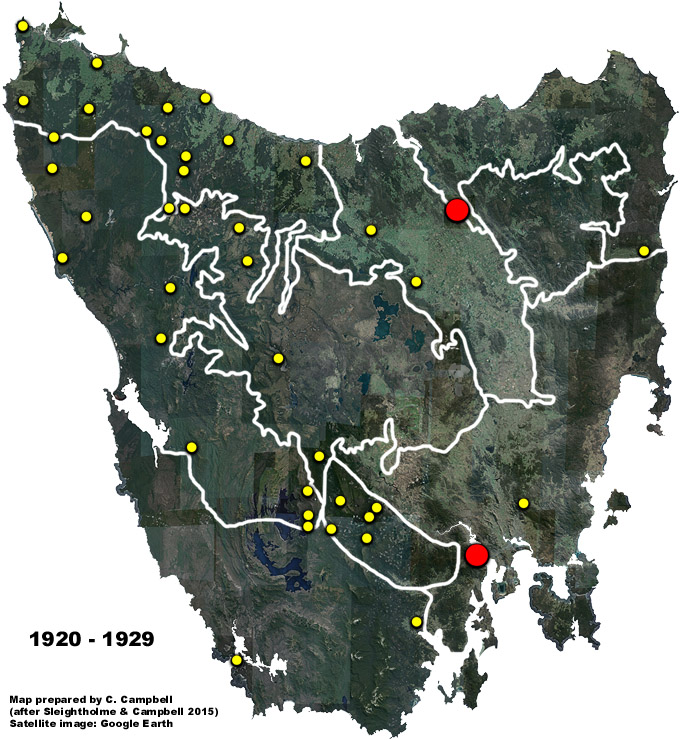
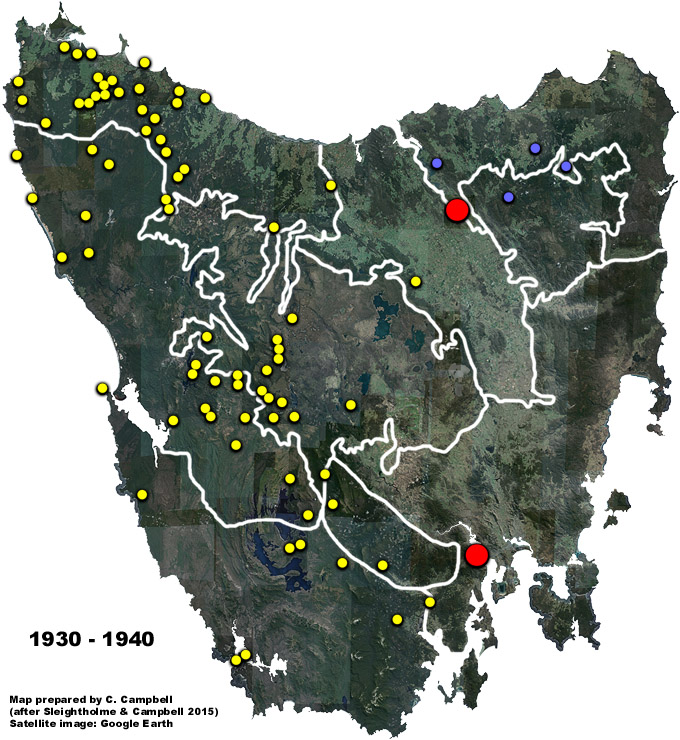
Place
your pointer over the maps to see the place names of the location markers. |
.
.
.
Note:
The blue markers in the TNE and TBL regions in the 1930-1940 map above
are thought to be possibly due to dating discrepancies and misidentifications. |
.
Sleightholme & Campbell (2015) state: "The CKS [Capture,
Kill
&
Sightings] data provides the most accurate assessment of
the thylacine's post-1900 distribution to date. Historically, the
species' distribution was continuous from the east to west coasts, with
population densities highest in the dry and mixed sclerophyll forests and
coastal heath of the east and north-west coasts, and lowest in the buttongrass
plains of the south and south-west. At the beginning of the 20th
century, the records show that there were three main thylacine populations
in Tasmania. An eastern population in the area of the Ben Lomond
National Park, a central population in the Highlands, and a northwestern
population in
the area of the Arthur-Pieman rivers. Of these, the Central Highlands
population was by far the largest. It is also known that a fragmented
southern population existed along the |
south-west
coast. That there was movement between these populations is evidenced
by the rapid spread of the epizootic disease. The CKS records confirm
that between 1900 and 1910, the thylacine population experienced a rapid
decline, and the probable cause was not bounty hunting, but disease.
The records reveal that the thylacine became extinct in the eastern half
of the state in the early 1920s, and from its former strongholds in the
Midlands and Central Highlands by the early 1930s. The remaining
population became fragmented in the 1930s, with an Arthur-Pieman population
in the north-west, a Franklin-Gordon population in the west, a Florentine
population to the south and a Cape Sorrell - Port Davey population along
the south-west coast. The study supports the
existence of
a corridor linking the three main populations as proposed by Bailey.
The authors contend that the thylacine survived with near certainty beyond
the death of the last captive specimen in 1936, and that the species was
extant throughout the 1940s, and possibly beyond". |
.
.
East-to-west
decline in thylacine populations from 1900 to 1940. Stippling represents
the area of known occurrence.
After
Sleightholme & Campbell (2015).
|
|
Remarkably, the east-to-west extinction of the thylacine as demonstrated
by Sleightholme & Campbell (2015) is virtually mirrored by the spread
of DFTD in the Tasmanian devil population, as shown in the following map
from a recent paper entitled
"Rapid evolutionary response to a transmissible
cancer in Tasmanian devils", published in the journal Nature Communications
(Epstein et al., 2016). This would indicate, as Paddle (2000) suggests,
and Sleightholme & Campbell (2015) concur, that disease played an important
part in the thylacine's demise.
.
|
The magenta lines indicate
the approximate location of the DFTD front in 2000, 2005, 2010 and 2015.
The three focal populations used in the study are labeled with large magenta
circles. The small grey circles mark additional sampling sites.
Source: Epstein, et al. (2016).
|
|

")

")